function [ ] = odeIllustration( )
k = 0.1;
N = 400;
t = (1:(N+1))*k;
y = zeros(N+1,1);
y(1) = 1;
for i=1:N
y(i+1) = y(i) + k * y(i);
end
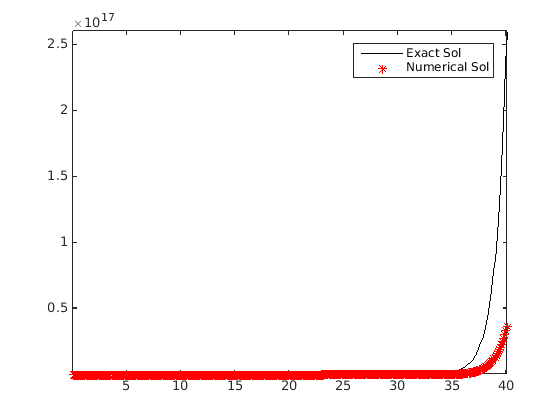
figure(1); clf;
exacty = exp(t);
plot(t, exacty, 'k-', t, y, 'r*');
legend('Exact Sol','Numerical Sol');
axis tight
k = 0.1;
N = 400;
t = (1:(N+1))*k;
y = zeros(N+1,1);
y(1) = 0;
for i=1:N
y(i+1) = y(i) + k * cos(t(i));
end
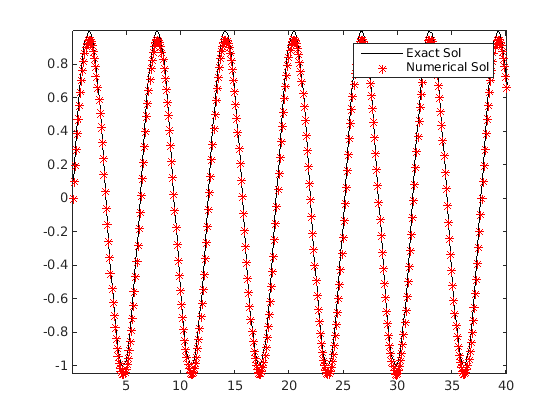
figure(2); clf;
exacty = sin(t);
plot(t, exacty, 'k-', t, y, 'r*');
legend('Exact Sol','Numerical Sol');
axis tight
k = 0.1;
N = 400;
t = (1:(N+1))*k;
y = zeros(N+1,1);
y(1) = 0;
for i=1:N
y(i+1) = y(i) + k * (y(i)/t(i) + t(i)*cos(t(i)));
end
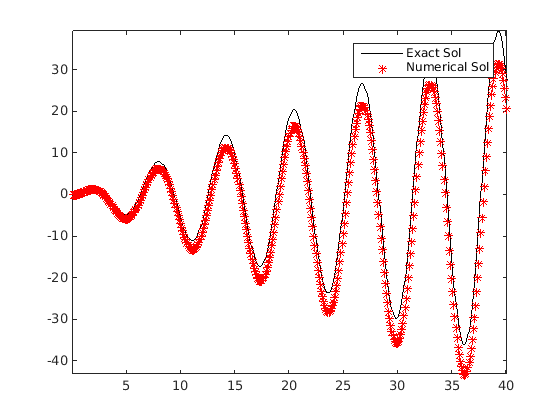
figure(3); clf;
exacty = t.*sin(t);
plot(t, exacty, 'k-', t, y, 'r*');
legend('Exact Sol','Numerical Sol');
axis tight
end